Inventory & SMART
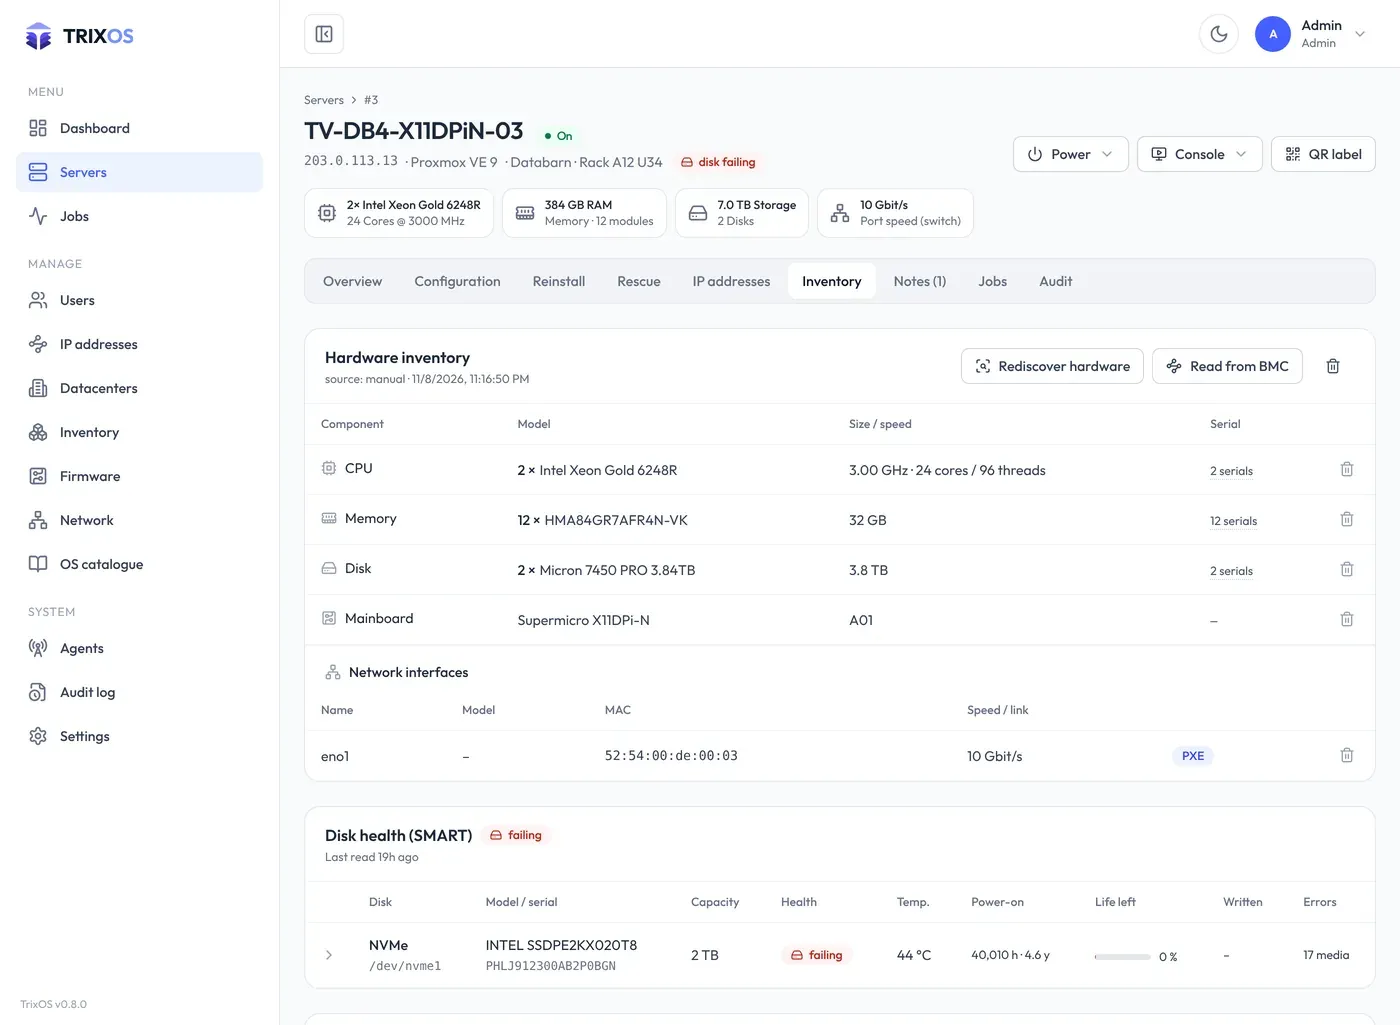
A server’s inventory
Section titled “A server’s inventory”The Inventory tab of a server starts with the Hardware inventory card, followed by disk health (SMART) and the firmware versions. The hardware is grouped in sections (CPUs, Memory, Disks, RAID volumes, controllers …), each with a count and total and collapsible (Collapse all / Expand all); a search box finds parts by model, serial or slot, and long lists get pages (the page size is remembered in the browser). Identical parts share one row (“8 × 32 GB DDR4” with their slots below; the serials are in the tooltip of “8 serials”). Where an OS scan, the import or a manual entry knows a component, the BMC’s rows for it are not listed again. CPU names are shown without “(R)”, “CPU” and the clock (that is in the next column); the full name is in the tooltip. The card lists:
- CPUs (model, base and turbo clock, cores / threads), memory modules (size, type, speed, slot)
- Disks: also the physical disks behind HPE Smart Array, MegaRAID / PERC and other RAID controllers. A RAID
volume (an HPE logical drive, a PERC virtual disk) is listed separately as RAID volume, so its size is not
counted twice. Without
smartctlthe volume is listed as the disk. - RAID / HBA / SATA controllers: model, firmware, mode (RAID / HBA), cache and battery / capacitor state (from
ssacli,hpssacli,storcliorperccliwhen installed, otherwise from the PCI data and the driver) - GPUs and accelerators (the BMC’s onboard graphics is marked as such), power supplies (from DMI), mainboard, chassis
- Network interfaces: name, model, driver, firmware, MAC, speed, link and the PXE NIC
BIOS and BMC firmware are in the Firmware card. Data comes from:
- Rediscover hardware (below): PXE, a shell command, or the running rescue system.
- The BMC, for BIOS and BMC firmware versions (read daily and on demand), and for the hardware itself until an OS scan exists (Hardware from the BMC).
- Manual entries by admins.
The hardware summary feeds the badges at the top of the server page (CPU, RAM, storage, port speed), the server list columns (CPU model, cores, memory, disks, mainboard) and the global inventory. Probes that failed on the server (a missing tool, an unreadable controller) are listed as warnings in the job log; the rest of the report is stored anyway.
Hardware from the BMC
Section titled “Hardware from the BMC”A server that was never scanned, or whose inventory was cleared, still gets the basics from its BMC, without touching the server: CPUs, memory, disks, NIC ports and power supplies. Nothing is changed on the BMC (only reads), so this also works on protected servers.
| BMC | What is read |
|---|---|
| HPE iLO 4 / iLO 5 (Redfish) | CPUs (model, sockets, cores, threads, base clock), DIMMs (size, type, speed, slot, part number), Smart Array controllers and their physical disks (model, size, SSD / HDD, SAS / SATA, bay, firmware), NIC ports of the network adapters (MAC, link speed), power supplies, system model and serial |
| Dell iDRAC, Lenovo XCC, Supermicro (Redfish) | the same from the standard Redfish resources: processors, memory, storage controllers and drives (or SimpleStorage), Ethernet interfaces, power supplies |
| Plain IPMI | FRU data: system model and serial, CPU models where the BMC lists them (HPE), power supplies; memory slots in use from the sensor list (count only, no size) |
An endpoint entered as IPMI with the vendor HPE, Dell, Lenovo or Supermicro is read over Redfish with the same host and account; if Redfish does not answer, TrixOS falls back to IPMI FRU.
When it runs:
- automatically for servers without any CPU, memory or disk data: right after the BMC is saved, after a TenantOS import, and once a day with the firmware check;
- Inventory → Read from BMC (admins) at any time.
Rows from the BMC are marked BMC in the inventory, and the header badges say so in their tooltip.
An OS scan always wins. Per component (CPUs, memory, disks, storage controllers, NICs, power supplies, system board): if the server has rows from an OS scan, the TenantOS import or a manual entry, the BMC data for that component is not stored. Otherwise the BMC replaces its own earlier rows. The next Rediscover hardware replaces all BMC rows with what the OS reports. A BMC that does not report something (a section it can’t read) leaves the earlier rows as they are.
The figures are what the BMC says: the base clock (a BMC’s “max speed” is the socket’s limit, not the turbo clock, so no turbo is shown); disks behind a RAID controller as physical disks; on blades, no power supplies (the enclosure has them). When only the total memory is known, the RAM badge shows the size without a module count.
Port speed badge: the speed of the switch port the server is connected to; without a mapped switch port, the fastest NIC link known from an OS scan or the BMC. A NIC known from an OS scan without a speed gets the BMC’s link speed.
Rediscover hardware
Section titled “Rediscover hardware”Inventory → Rediscover hardware offers three ways:
| Option | Reboot | When |
|---|---|---|
| Via PXE | yes, the server is powered off afterwards | no OS installed, or no shell access. Needs a BMC and everything a PXE job needs (OS installs & rescue). |
| Via shell command | no | a running Linux system you can log in to |
| In the running rescue system | no | the server runs the TrixOS rescue system (GRML or SystemRescue, started by TrixOS 0.7 or later) |
A server running its installed system cannot get a PXE task without a reboot: PXE is how the firmware boots. That case is the shell command.
Via shell command
Section titled “Via shell command”You get a one-line command for the running system:
curl -fsSL 'http://databarn.agent.example.net:8080/pxe/jobs/<job>/<token>/discover.sh' | sudo shRun it as root. It needs python3; dmidecode, smartmontools and pciutils are installed for the run if
they’re missing and removed again. The command is valid for 2 hours or until its report arrives; starting a new
discovery replaces an unfinished one.
At a site with an agent, the command uses the agent’s hostname (as the agent reports it) when that name resolves
to the agent’s address, otherwise its IP; the dialog says why. While the discovery is open, the agent lets the
server’s IPs through to its HTTP port (agent 1.3.1 or later; older agents only did that for PXE jobs, so the command
timed out: update the agent under System → Agents). Without an agent, the server must reach the panel’s
boot-file URL (PXE_HTTP_BASE).
In the running rescue system
Section titled “In the running rescue system”A rescue system started by TrixOS asks the panel every 20 seconds whether there is something to do (authenticated with its rescue job’s token, through the site agent). Rediscover hardware → In the running rescue system queues the scan; the rescue system picks it up, runs the same collector and sends the report. The option is available while the rescue system checks in; it ends when another job (power, reinstall, a new rescue, …) runs for the server, or after 24 hours.
Via PXE
Section titled “Via PXE”Boots the TrixOS live image over PXE, reports the same data and then powers the server off. A rescan replaces the installed parts of that server; parts you moved to stock on the Inventory page are not touched.
Remove entries
Section titled “Remove entries”Admins can delete a single component (a DIMM that was pulled, a replaced disk, a NIC) from the Inventory tab, or clear the whole inventory of a server, optionally including its NICs, SMART history and firmware history.
SMART on every PXE boot
Section titled “SMART on every PXE boot”Whenever a server boots over PXE (rescue, rescan, disk wipe, password reset and every OS install), TrixOS reads
SMART data from each disk with smartctl, including physical disks behind HPE Smart Array controllers. Installs read
it inside the new system, with smartmontools installed for the run and removed again. Discovery without a reboot
reads it too.
Each disk gets a status:
| Status | Meaning |
|---|---|
| ok | No problems reported |
| warning | Reallocated, pending or uncorrectable sectors, media errors, 90 % or more of the rated endurance used, high temperature, or entries in the error log |
| failed | The disk’s own health check failed, a SMART attribute is failing now, or an NVMe critical warning is set |
| unknown | The disk reported no usable SMART data |
Inventory → Disk health shows the current disks of a server; click one for its full report and history.
Lifetime figures
Section titled “Lifetime figures”For SSDs and NVMe drives TrixOS shows the remaining endurance in percent and an estimate of the remaining lifetime at the wear rate seen so far. Further figures, where the disk reports them: data written and read, available spare, unsafe shutdowns, power-on hours and cycles, start/stop and load cycles, spin retries, interface CRC errors, error log entries, the last self-test, maximum temperature, interface speed and form factor.
The server list has Disk health and Disk life left columns, and the dashboard’s Hardware health card lists servers with failing disks, disk warnings and firmware updates.
Alerts
Section titled “Alerts”When a disk turns warning or failed, TrixOS sends the webhook event disk.unhealthy
(Notifications).